Scientific Reportsvolume 8, Article number: 13177 (2018) | Download Citation
Abstract
A terahertz (THz) bottle beam is realized by adopting the combination of a Teflon axicon and a silicon lens. By using a THz imaging system with a focal-plane array, the vector characteristics of the THz bottle beam are coherently measured and detailedly analyzed, including the transverse (Ex) and longitudinal (Ez) components. The experimental phenomena vividly reveal the distribution characteristics and the formation origin of the THz optical barrier. A vectorial diffraction integral algorithm of a focusing optical system are utilized to exactly simulate the measured results. Besides, the features of the THz bottle beam are effectively tuned by varying the parameters of the Teflon axicon and the silicon lens. This work gives a full view to understand the evolution characteristics of the THz bottle beam and provide a solid experimental foundation for guiding the future applications of this type of THz beam.
Since the concept of an optical bottle beam was introduced by Arlt et al. in 20001, this sort of special beam has attracted growing attentions due to its unique applications in particle trapping2 and simulated emission depletion (STED) fluorescence microscopy3.
An optical bottle beam possesses an intensity null which are surrounded
by an optical barrier in three dimensions so that it can be applied to
realize the manipulation of low index particles or the enhancement of
the longitudinal resolution in STED fluorescence microscopy. In the
visible light range, the generation and modulation of an optical bottle
beam have been widely investigated. In 2005, Wei et al. achieved the generation of an optical bottle beam by an apertured plane wave’s impinging through an axicon and a positive lens4. In 2013, Shvedov et al.
utilized a uniaxial crystal to form a vector bottle beam and fulfilled
the reconfiguration of the bottle beam by tuning the input beam
polarization and the crystal parameters5. In 2014, Ye et al. proposed a scheme for generating a bottle-hollow beam using a binary phase mask and a focusing lens6. In 2017, Vella et al.
proposed a generation method of an optical bottle field by placing a
stress engineered optical window at the pupil of an aplanatic high
numerical aperture focusing system7. As
a class of novel far-infrared optical inspection methods, the terahertz
(THz) sensing and imaging technology has shown powerful application
potentials in security inspection8, material identification9, non-invasive flaw detection10, and other numerous fields11,12,13 due
to the properties of the THz radiation, such as the broad bandwidth,
low photon energy, high penetration to non-metallic substances, and so
on14.
Currently, investigations of THz special beams have gradually become an
important development orientation, because it is possible that
distinctive features of these light beams are applied to broaden the
scope of THz application. In 2012, a broadband Bessel THz beam was
introduced into a THz scanning imaging system for enhancing the
capability of obtaining depth information15. In 2015, the longitudinal component of a THz vector vortex beam was utilized to realize the linear acceleration of electrons16. In 2015, two separate orbital angular momentum channels were applied to achieve a sub-THz wireless communication link17.
However, to our best knowledge, there is little investigation about an
optical bottle beam in the THz frequency range in the previous reports. In
this work, the THz bottle beam is generated by employing the
combination of a Teflon axicon and a silicon lens. The vector
characteristics of the THz bottle beam are coherently measured,
including the transverse (Ex) and longitudinal (Ez)
electric fields. The evolution of the THz bottle beam is recorded and
analyzed in detail by implementing a Z-scan measurement method. A
vectorial diffraction algorithm is adopted to reproduce the features of
the THz bottle beam. Besides, modulations of the THz bottle beam are
fulfilled by varying the distance between the Teflon axicon and the
silicon lens, the base angle of the Teflon axicon, and the focal length
of the silicon lens. This work presents the vector characteristics and
the basic modulation techniques for a THz bottle beam in detail. To
acquire the vector characteristics of a THz bottle beam, a THz imaging
system with a focal-plane array is used as the measurement platform.
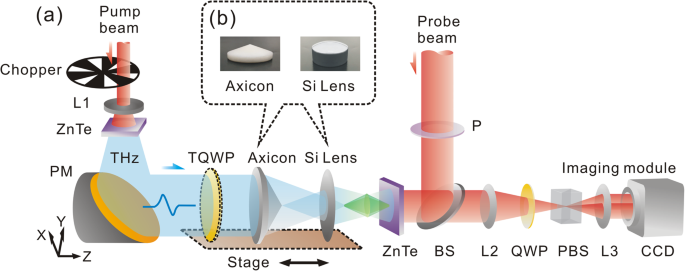
Figure 1a shows
its schematic diagram. A THz quasi-plane wave with an x-linear
polarization emerges through a Teflon axicon and a silicon lens to form a
THz bottle beam, as shown in Fig. 1b. The transverse (Ex) and longitudinal (Ez)
components of the THz bottle beam are coherently detected by applying
the imaging system. To analyze the formation origin of the THz bottle
beam, the positions of the Teflon axicon and the silicon lens are
together successively adjusted for operating a Z-scan measurement. The
diffraction process of the THz beam is recorded from z = −4.5 mm to
z = 4.5 mm and the scanning step is set as 0.5 mm. It should be noted
that the focal point of the silicon lens is viewed as the base point. In
addition, a quartz THz quarter wave plate (TQWP, TYDEX Company, Russia)
is also applied to vary the THz polarization. Experimental system and samples. (a) THz imaging system with a focal-plane array. (b)Pictures of a Teflon axicon and a silicon lens.Introduction
Experimental Design
Firstly, a THz bottle beam with a x-linear polarization is formed by adopting a Teflon axicon with an base angle of 20° and a silicon lens with a focal length of 8 mm. The distance between the Teflon axicon and the silicon lens is about 35 mm. The 0.75 THz component is acquired by implementing the Fourier transformation. The amplitude images of Ex on the x-y plane at z = −4.5 mm, 0 mm, 4.5 mm are exhibited, as shown in Fig. 2a. Clearly, the THz field at z = −4.5 mm exhibits a circular central main spot with a diameter of 0.6 mm and two annular side-lobes with radiuses of 0.72 mm and 1.43 mm, which presents the distribution characteristics of a Bessel-like function. Here, the full widths at half maximum (FWHM) of the THz amplitude is viewed as the diameter of the main spot. The radius of the THz annular side-lobe is considered as the length between the maximum value and the central point. The amplitude image presents a doughnut pattern with a radius of 1.23 mm on the focal plane of the silicon lens (z = 0 mm), which possesses a central dark focus surrounded by a uniform optical barrier. After the THz beam passing through the focal plane, the amplitude image at z = 4.5 mm exhibits the Bessel-like distribution pattern once again, which are almost the same as the THz field at z = −4.5 mm. To observe the formation origin of the THz bottle beam, the cross-section of the THz amplitude on the x-z plane is extracted, as shown in Fig. 2b. Obviously, with the propagation of the THz beam, the central peak intensity of the THz field gradually attenuates and the dark focus appears until the sharpest ring of the THz beam is formed from z = −4.5 mm to 0 mm. After passing through the position of z = 0 mm, the reverse diffraction process is generated. Namely, the edge of the THz light ring progressively becomes ambiguous and the central dark focus starts to shrink. Finally, the THz intensity concentrates into the center and become a peak again. The evolution properties of the THz beam are consistent with those of a typical optical bottle beam1.
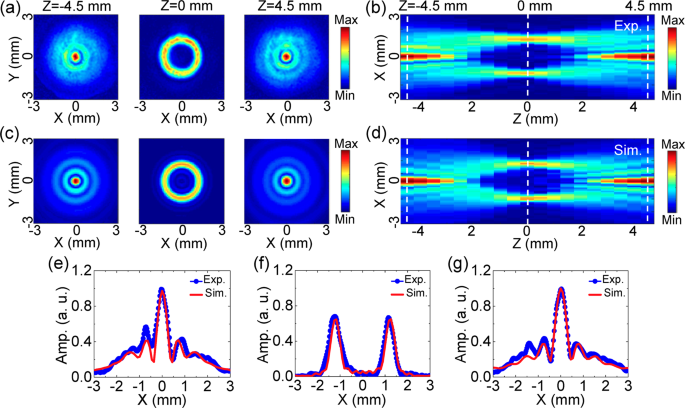
Amplitude image of Ex with 0.75 THz for the linearly polarized THz bottle beam. (a)Amplitude images of Ex on the x-y plane at z = −4.5 mm, 0 mm, 4.5 mm. (b) Longitudinal amplitude cross-section of Ex on the x-z plane. (c) and (d) gives the corresponding simulated results, including transverse amplitude images at z = −4.5 mm, 0 mm, 4.5 mm as well as the longitudinal amplitude pattern. (e–g) Plot the measured and calculated amplitude curves on the lines of z = −4.5 mm, 0 mm, 4.5 mm. Three white dashed lines are inserted in (b,d) to indicate their positions.